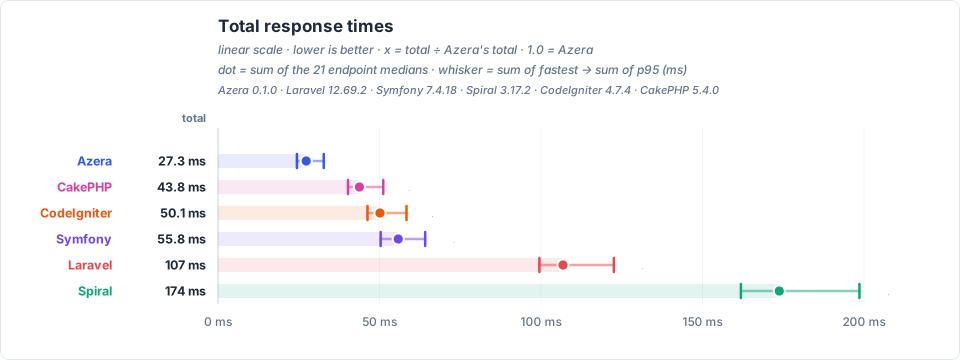
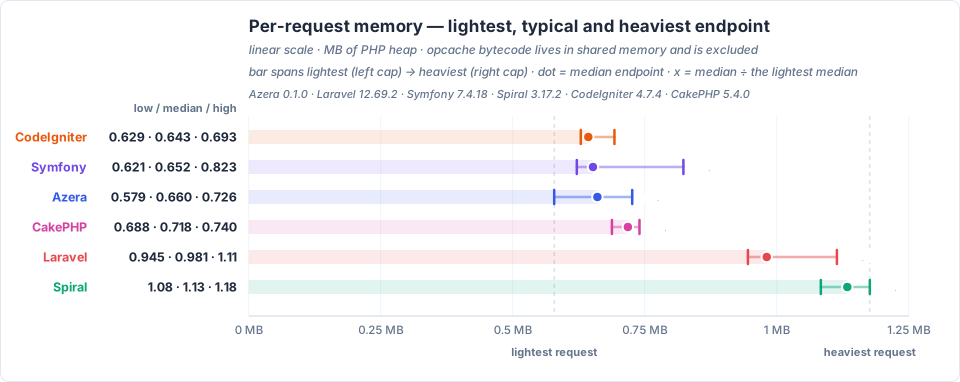
Feature benchmarks
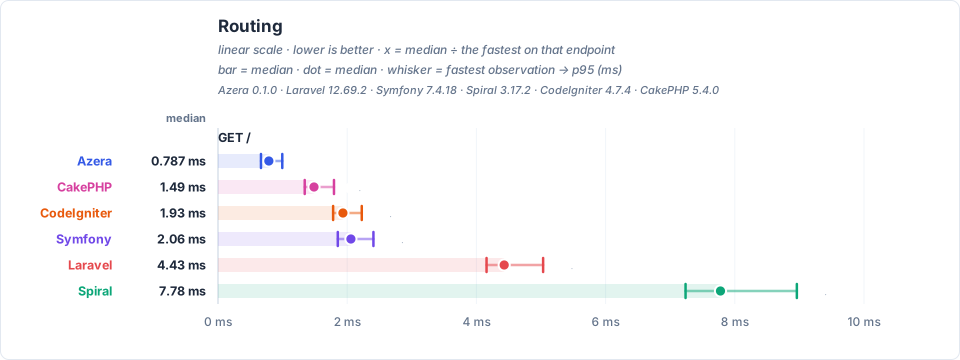
GET / — dispatches a plain request through the router and returns a rendered template — no database access.
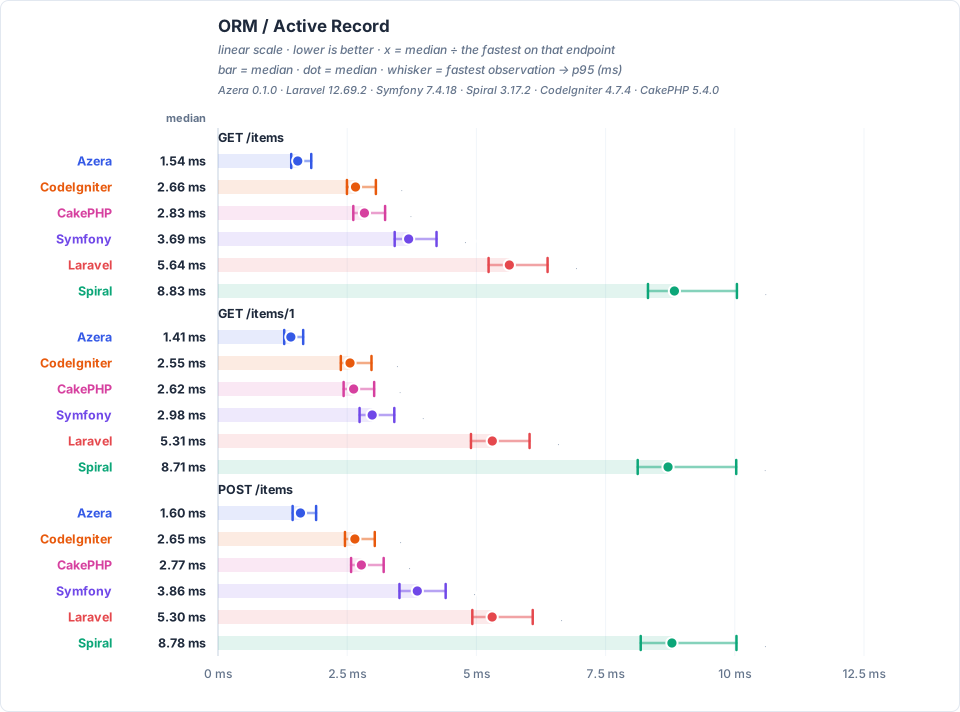
GET /items — loads one page of the 1,000 seeded rows through each framework's ORM / Active Record layer: 20 items plus a COUNT for the pagination total.
GET /api/items — serves the same page of items as a JSON response rather than HTML, which adds serialization to the ORM work.
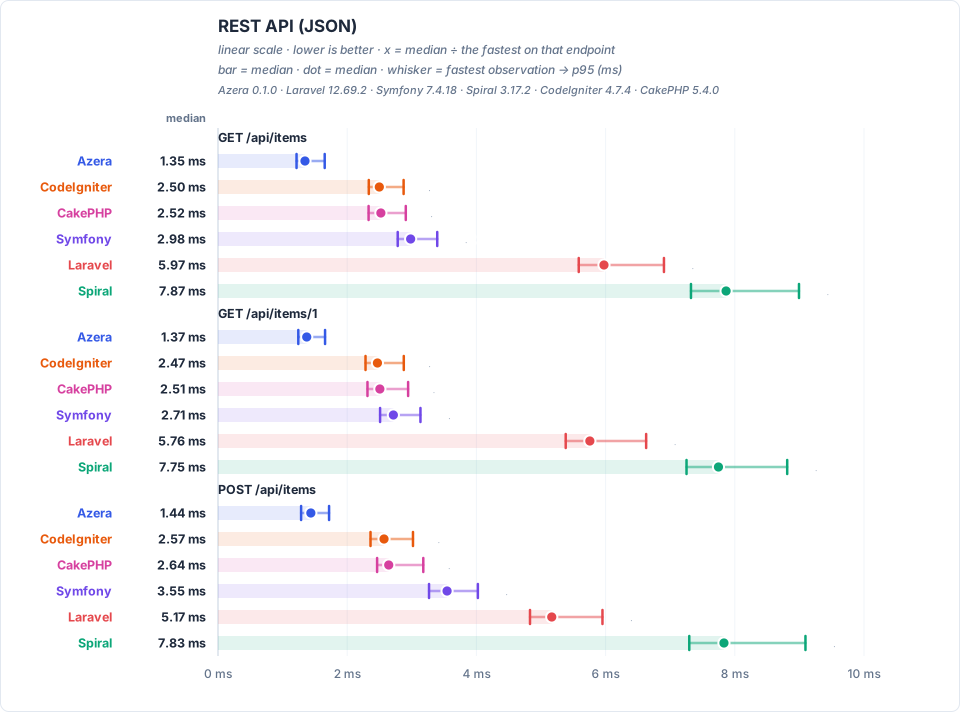
Latency by endpoint (ms, trimmed mean — lower is better)
| Request | Workload | Azera | Laravel | Symfony | Spiral | CodeIgniter | CakePHP |
|---|---|---|---|---|---|---|---|
GET / | no DB — routing + template only | 0.810 | 4.51 | 2.10 | 7.93 | 1.97 | 1.53 |
GET /items | 20 of 1000 items (page 1, + COUNT) | 1.58 | 5.74 | 3.76 | 8.99 | 2.72 | 2.89 |
GET /items/1 | 1 item by id | 1.44 | 5.40 | 3.04 | 8.88 | 2.61 | 2.69 |
POST /items | 1 row upserted (sentinel #999999) | 1.64 | 5.40 | 3.92 | 8.96 | 2.71 | 2.85 |
GET /items-qb | 20 of 1000 items (page 1, + COUNT) | 1.40 | 5.24 | 2.66 | 8.51 | 2.69 | 2.30 |
GET /items-qb/1 | 1 item by id | 1.34 | 5.11 | 2.58 | 8.45 | 2.59 | 2.20 |
POST /items-qb | 1 row upserted (sentinel #999997) | 1.44 | 5.17 | 3.47 | 8.65 | 2.82 | 2.32 |
GET /api/items | 20 of 1000 items as JSON | 1.38 | 6.09 | 3.03 | 8.01 | 2.54 | 2.58 |
GET /api/items/1 | 1 item by id as JSON | 1.41 | 5.88 | 2.77 | 7.89 | 2.52 | 2.56 |
POST /api/items | 1 row upserted (sentinel #999998) | 1.47 | 5.28 | 3.60 | 8.03 | 2.64 | 2.71 |
GET /features/aop | no DB — interceptor pipeline | 2.52 | 5.99 | 3.27 | 9.66 | — | — |
GET /features/cache | COUNT(*) of 1000 rows, cached 10s (miss = query) | 1.66 | 5.36 | 2.98 | 8.77 | 2.50 | 2.42 |
GET /features/log | no DB — buffered log handlers | 1.23 | 4.52 | 1.95 | 8.06 | — | — |
GET /features/retry | no DB — retry policy | 1.22 | 4.62 | 1.97 | 8.06 | — | — |
GET /features/pipeline | no DB — middleware pipeline | 0.811 | 4.56 | 1.98 | 8.07 | — | — |
GET /features/db-events | 1 event row INSERTed per request | 1.75 | 5.43 | 3.16 | 9.00 | 2.79 | 2.64 |
GET /features/events | no DB — in-process listeners | 1.73 | 5.12 | 2.41 | 8.67 | 2.69 | 1.94 |
GET /features/validation | no DB — validator run | 0.823 | 5.62 | 2.29 | 8.18 | 2.29 | 1.84 |
GET /features/config | no DB — config lookup | 0.765 | 4.59 | 1.96 | 8.07 | 1.97 | 1.40 |
GET /features/request-scoped | no DB — scoped service resolve | 0.770 | 4.59 | 1.98 | 8.07 | 1.95 | 1.41 |
GET /features/rate-limit | no DB — cache-backed limiter | 0.772 | 4.73 | 2.00 | 8.16 | 1.96 | 1.51 |
Server floor — real nginx + PHP-FPM with pm.max_requests=0: the pool never recycles its worker, so no process is spawned per request — what remains is the FastCGI handshake plus a minimal script. A hello-world endpoint that boots nothing but PHP (floor-php) and a static file through nginx (floor-http) measure exactly that cost — the floor every row stands on. Subtracting that floor leaves the framework's own per-request boot, which FPM still pays for every request even though its worker survives.
Full comparison
This page is a summary. The complete report, with every feature chart and the endpoint table for all six frameworks, is published at: